
Validation against official results and the census
Source:vignettes/articles/validation.Rmd
validation.RmdThis page downloads 11 studies (about 16 MB) the
first time it runs. options(qesR.cache = "disk") keeps them
on disk for later sessions.
How close do the harmonized studies come to what is known about the electorate? This page compares, for every study the harmonization specification covers:
- the reported vote with the official results of each general election, published by Élections Québec;
- the reported turnout with the official turnout;
- the gender, age, mother tongue and education of respondents with the census that precedes the study (Statistics Canada);
- a few relationships between answers that any valid measure should show (construct validity).
Every study is harmonized with qes_harmonize() from its
original data file. The same comparisons run automatically on the
original files, so a mapping error that moved these numbers would be
caught.
# every study the specification covers, harmonized from the original files,
# against the benchmarks that ship with qesR (internal functions, not part
# of qesR's interface)
report <- qesR:::.qes_validation_run("all")
report <- qesR:::.qes_validation_gate(report, qesR:::.qes_validation_recorded())
1. Reported vote and official results
For each study, the table gives the dissimilarity index between the distribution of the reported vote and the official shares of valid votes: half the sum of the absolute differences between the two distributions, in points. It is the share of respondents who would have to change party for the two to agree; 0 is a perfect match. Parties that the study’s question did not list are counted as “other party” on the official side, since that is the only answer their voters could give.
| Study | Election | N (reported a party) | Index, unweighted | Index, weighted |
|---|---|---|---|---|
| qes1998 | QC1998 | 1126 | 9.4 | |
| qes2007 | QC2007 | 1727 | 7.7 | 7.3 |
| qes2007_panel | QC2007 | 1494 | 4.5 | |
| qes2008 | QC2008 | 898 | 3.2 | |
| qes2012 | QC2012 | 1274 | 11.0 | 8.0 |
| qes2012_panel | QC2012 | 633 | 8.7 | |
| qes2014 | QC2014 | 1283 | 4.9 | 5.6 |
| qes2018 | QC2018 | 2016 | 3.2 | 3.2 |
| qes2018_panel | QC2018 | 704 | 5.5 | 5.5 |
| qes2022 | QC2022 | 1101 | 9.0 | 8.0 |
The weighted index uses the weight the specification recommends for
the wave that asked the question; qes2007,
qes2012, qes2014, qes2018,
qes2022 and the 2018 panel have one. The weights of
qes2007_panel, qes2012_panel, the CROP polls
and qes1998 are not validated, and qes2008 has
no recommended weight (both of its weights are calibrated on the vote or
on turnout), so their index is unweighted; the weights table describes each study’s
weight. qes1998 interviewed francophones only, a population
the official results do not describe: it is shown for reference but not
checked.
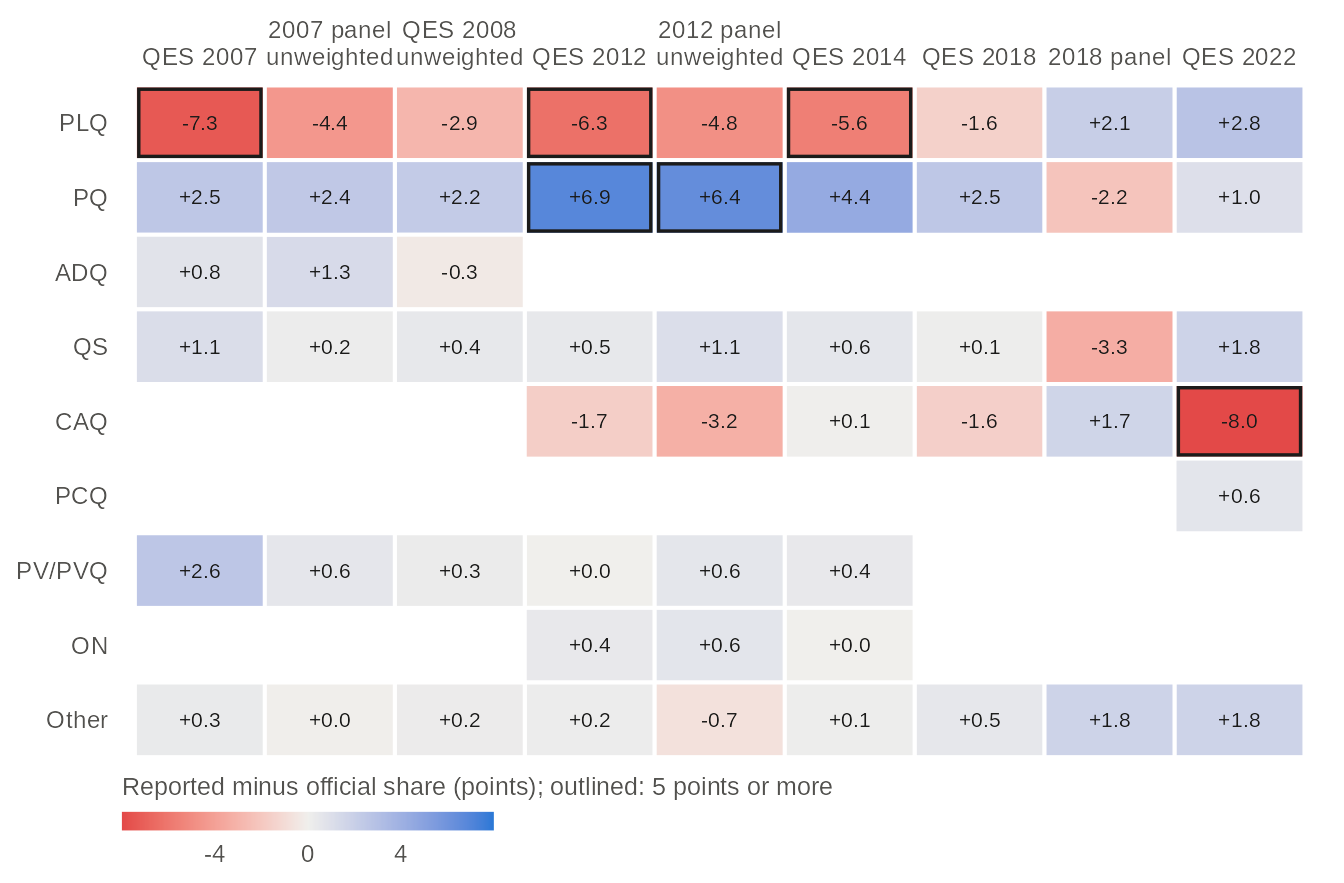
Weighted with the study's weight where it has a usable one; the 2008 study and the 2007 and 2012 Durand panels are unweighted. A blank cell: the party did not run, or the study counts it in Other. The 1998 polls, which interviewed francophones only, are left out.
Table view
| Study | Weighting | Party | Reported minus official (points) |
|---|---|---|---|
| QES 2007 | weighted | PLQ | -7.3 |
| QES 2007 | weighted | PQ | +2.5 |
| QES 2007 | weighted | ADQ | +0.8 |
| QES 2007 | weighted | QS | +1.1 |
| QES 2007 | weighted | PV/PVQ | +2.6 |
| QES 2007 | weighted | Other | +0.3 |
| 2007 panel | unweighted | PLQ | -4.4 |
| 2007 panel | unweighted | PQ | +2.4 |
| 2007 panel | unweighted | ADQ | +1.3 |
| 2007 panel | unweighted | QS | +0.2 |
| 2007 panel | unweighted | PV/PVQ | +0.6 |
| 2007 panel | unweighted | Other | +0.0 |
| QES 2008 | unweighted | PLQ | -2.9 |
| QES 2008 | unweighted | PQ | +2.2 |
| QES 2008 | unweighted | ADQ | -0.3 |
| QES 2008 | unweighted | QS | +0.4 |
| QES 2008 | unweighted | PV/PVQ | +0.3 |
| QES 2008 | unweighted | Other | +0.2 |
| QES 2012 | weighted | PLQ | -6.3 |
| QES 2012 | weighted | PQ | +6.9 |
| QES 2012 | weighted | QS | +0.5 |
| QES 2012 | weighted | CAQ | -1.7 |
| QES 2012 | weighted | PV/PVQ | +0.0 |
| QES 2012 | weighted | ON | +0.4 |
| QES 2012 | weighted | Other | +0.2 |
| 2012 panel | unweighted | PLQ | -4.8 |
| 2012 panel | unweighted | PQ | +6.4 |
| 2012 panel | unweighted | QS | +1.1 |
| 2012 panel | unweighted | CAQ | -3.2 |
| 2012 panel | unweighted | PV/PVQ | +0.6 |
| 2012 panel | unweighted | ON | +0.6 |
| 2012 panel | unweighted | Other | -0.7 |
| QES 2014 | weighted | PLQ | -5.6 |
| QES 2014 | weighted | PQ | +4.4 |
| QES 2014 | weighted | QS | +0.6 |
| QES 2014 | weighted | CAQ | +0.1 |
| QES 2014 | weighted | PV/PVQ | +0.4 |
| QES 2014 | weighted | ON | +0.0 |
| QES 2014 | weighted | Other | +0.1 |
| QES 2018 | weighted | PLQ | -1.6 |
| QES 2018 | weighted | PQ | +2.5 |
| QES 2018 | weighted | QS | +0.1 |
| QES 2018 | weighted | CAQ | -1.6 |
| QES 2018 | weighted | Other | +0.5 |
| 2018 panel | weighted | PLQ | +2.1 |
| 2018 panel | weighted | PQ | -2.2 |
| 2018 panel | weighted | QS | -3.3 |
| 2018 panel | weighted | CAQ | +1.7 |
| 2018 panel | weighted | Other | +1.8 |
| QES 2022 | weighted | PLQ | +2.8 |
| QES 2022 | weighted | PQ | +1.0 |
| QES 2022 | weighted | QS | +1.8 |
| QES 2022 | weighted | CAQ | -8.0 |
| QES 2022 | weighted | PCQ | +0.6 |
| QES 2022 | weighted | Other | +1.8 |
2. Reported turnout
| Study | Election | Weighting | N | Reported turnout (%) | Official turnout (%) | Difference (points) |
|---|---|---|---|---|---|---|
| qes1998 | QC1998 | unweighted | 1483 | 87.4 | 78.3 | +9.1 |
| qes2007 | QC2007 | weighted | 2162 | 90.7 | 71.2 | +19.5 |
| qes2007_panel | QC2007 | unweighted | 2054 | 85.3 | 71.2 | +14.1 |
| qes2008 | QC2008 | unweighted | 1131 | 87.2 | 57.4 | +29.8 |
| qes2012 | QC2012 | weighted | 1486 | 93.2 | 74.6 | +18.6 |
| qes2012_panel | QC2012 | unweighted | 844 | 92.2 | 74.6 | +17.6 |
| qes2014 | QC2014 | weighted | 1499 | 88.9 | 71.4 | +17.5 |
| qes2018 | QC2018 | weighted | 2635 | 83.2 | 66.5 | +16.8 |
| qes2018_panel | QC2018 | weighted | 842 | 83.7 | 66.5 | +17.2 |
| qes2022 | QC2022 | weighted | 1215 | 90.0 | 66.2 | +23.8 |
Official turnout is ballots cast over registered electors. Reported turnout is the share who say they voted among respondents who answered yes or no; those not registered or not eligible, and those who did not know or would not say, are left out.
3. Respondents and the census
Each study is compared with the census that precedes its election (2006, 2011, 2016 or 2021). Gender and age are compared at 18 and over; for mother tongue and education, whose tables have no 18-and-over cut, the nearest published age cut is used, and respondents are cut the same way when their age is known:
| Margin | Census | Population compared | Table |
|---|---|---|---|
| Gender, age (six bands) | 2016, 2021 | 18 and over | 98-10-0020-01 |
| Gender, age (six bands) | 2011 | 18 and over | Census Profile 98-316-XWE2011001 |
| Gender, age (six bands) | 2006 | 18 and over | 97-551-XCB2006009 |
| Mother tongue | 2011, 2016, 2021 | 20 and over, outside institutions, one mother tongue | 98-10-0218-01 |
| Education | 2006 to 2021 | 25 and over, private households | 98-10-0384-01 |
The 2011 education counts come from the National Household Survey, which was voluntary. The 2006 table 97-551-XCB2006009 is no longer on Statistics Canada’s site; its file was retrieved from the Internet Archive. The one 2006 table found with mother tongue by age counts institutional residents and many more multiple mother tongues, so 2006 has no mother-tongue comparison. Mother tongue is compared among people who report one mother tongue: the census’s multiple answers and the surveys’ answers naming two languages are left out. Education is compared as university (any university certificate, diploma or degree) or below.
| Study | Census | Weighting | Gender | Age | Mother tongue | Education |
|---|---|---|---|---|---|---|
| qes_crop_2007_2010 | Census 2006 | unweighted | 6.9 | 5.9 | 13.5 | |
| qes2007 | Census 2006 | unweighted | 5.2 | 11.2 | 20.8 | |
| qes2007 | Census 2006 | weighted | 0.1 | 6.6 | 20.5 | |
| qes2007_panel | Census 2006 | unweighted | 5.7 | 6.1 | 10.6 | |
| qes2008 | Census 2006 | unweighted | 2.1 | 3.8 | 22.9 | |
| qes2012 | Census 2011 | unweighted | 2.3 | 15.9 | 4.5 | 18.5 |
| qes2012 | Census 2011 | weighted | 0.0 | 0.1 | 0.9 | 17.6 |
| qes2012_panel | Census 2011 | unweighted | 8.8 | 11.9 | 9.4 | |
| qes2014 | Census 2011 | unweighted | 6.5 | 4.7 | 8.1 | 21.3 |
| qes2014 | Census 2011 | weighted | 0.0 | 0.1 | 4.8 | 9.1 |
| qes2018 | Census 2016 | unweighted | 0.2 | 14.0 | 8.6 | 18.7 |
| qes2018 | Census 2016 | weighted | 0.1 | 7.9 | 9.3 | 17.6 |
| qes2018_panel | Census 2016 | unweighted | 0.1 | 8.5 | ||
| qes2018_panel | Census 2016 | weighted | 0.3 | 8.7 | ||
| qes2022 | Census 2021 | unweighted | 1.2 | 2.5 | 11.9 | 19.4 |
| qes2022 | Census 2021 | weighted | 0.0 | 1.2 | 0.1 | 3.5 |
Each cell is a dissimilarity index in points (0 is a perfect match); a blank cell is a margin the study did not ask, or one the collected census tables do not publish for that year (mother tongue in 2006).


Studies with a usable weight, weighted; the census of the year before each study (Statistics Canada). Gender and education have two categories, so one row is shown (women; university): the other is its mirror. A margin is marked cal. when every category is within half a point of the census, as a margin the weight is raked on is by construction; a close match there says nothing about representativeness.
Table view
| Margin | Category | Study | Survey minus census (points) | Within half a point (cal.) |
|---|---|---|---|---|
| Education | University | QES 2007 | +20.5 | |
| Education | University | QES 2012 | +17.6 | |
| Education | University | QES 2014 | +9.1 | |
| Education | University | QES 2018 | +17.6 | |
| Education | University | QES 2022 | +3.5 | |
| Mother tongue | English | QES 2012 | +0.9 | |
| Mother tongue | English | QES 2014 | -0.9 | |
| Mother tongue | English | QES 2018 | +9.3 | |
| Mother tongue | English | 2018 panel | +8.4 | |
| Mother tongue | English | QES 2022 | +0.1 | yes |
| Mother tongue | French | QES 2012 | -0.4 | |
| Mother tongue | French | QES 2014 | +4.8 | |
| Mother tongue | French | QES 2018 | -2.0 | |
| Mother tongue | French | 2018 panel | +0.4 | |
| Mother tongue | French | QES 2022 | -0.1 | yes |
| Mother tongue | Other | QES 2012 | -0.4 | |
| Mother tongue | Other | QES 2014 | -3.9 | |
| Mother tongue | Other | QES 2018 | -7.3 | |
| Mother tongue | Other | 2018 panel | -8.7 | |
| Mother tongue | Other | QES 2022 | -0.1 | yes |
| Age | 18-24 | QES 2007 | +1.5 | |
| Age | 18-24 | QES 2012 | +0.0 | yes |
| Age | 18-24 | QES 2014 | +0.0 | yes |
| Age | 18-24 | QES 2018 | +0.4 | |
| Age | 18-24 | QES 2022 | -0.1 | |
| Age | 25-34 | QES 2007 | +1.4 | |
| Age | 25-34 | QES 2012 | +0.0 | yes |
| Age | 25-34 | QES 2014 | +0.0 | yes |
| Age | 25-34 | QES 2018 | +2.3 | |
| Age | 25-34 | QES 2022 | +0.1 | |
| Age | 35-44 | QES 2007 | +3.7 | |
| Age | 35-44 | QES 2012 | +0.0 | yes |
| Age | 35-44 | QES 2014 | +0.0 | yes |
| Age | 35-44 | QES 2018 | -4.0 | |
| Age | 35-44 | QES 2022 | +1.1 | |
| Age | 45-54 | QES 2007 | -0.8 | |
| Age | 45-54 | QES 2012 | +0.0 | yes |
| Age | 45-54 | QES 2014 | +0.0 | yes |
| Age | 45-54 | QES 2018 | -3.9 | |
| Age | 45-54 | QES 2022 | -0.2 | |
| Age | 55-64 | QES 2007 | -2.5 | |
| Age | 55-64 | QES 2012 | +0.0 | yes |
| Age | 55-64 | QES 2014 | +0.0 | yes |
| Age | 55-64 | QES 2018 | +4.6 | |
| Age | 55-64 | QES 2022 | -0.9 | |
| Age | 65 and over | QES 2007 | -3.3 | |
| Age | 65 and over | QES 2012 | +0.0 | yes |
| Age | 65 and over | QES 2014 | +0.0 | yes |
| Age | 65 and over | QES 2018 | +0.7 | |
| Age | 65 and over | QES 2022 | +0.0 | |
| Gender | Women | QES 2007 | +0.1 | yes |
| Gender | Women | QES 2012 | +0.0 | yes |
| Gender | Women | QES 2014 | +0.0 | yes |
| Gender | Women | QES 2018 | +0.1 | yes |
| Gender | Women | 2018 panel | -0.3 | yes |
| Gender | Women | QES 2022 | +0.0 | yes |
4. Relationships between answers
These checks do not compare with an outside source. They ask whether the harmonized answers relate to one another the way decades of research say they should; a mapping error (a party code swapped, a scale reversed) would break them.
| Study | Expected | Value | Compared with | Holds |
|---|---|---|---|---|
| qes2007 | Partisans who voted for their party: at least 55% (%) | 83.4 | yes | |
| qes2008 | Partisans who voted for their party: at least 55% (%) | 86.9 | yes | |
| qes2012 | Voters are more interested than nonvoters (mean, 1-4) | 2.9 | 2.3 | yes |
| qes2012 | QS voters are to the left of CAQ voters (mean, 0-10) | 3.1 | 6.3 | yes |
| qes2012 | Partisans who voted for their party: at least 55% (%) | 83.0 | yes | |
| qes2012 | Yes to independence: PQ voters more than 40 points above PLQ voters (%) | 84.5 | 1.3 | yes |
| qes2014 | Voters are more interested than nonvoters (mean, 1-4) | 3.0 | 2.3 | yes |
| qes2014 | QS voters are to the left of CAQ voters (mean, 0-10) | 3.4 | 5.7 | yes |
| qes2014 | Partisans who voted for their party: at least 55% (%) | 84.2 | yes | |
| qes2014 | Yes to independence: PQ voters more than 40 points above PLQ voters (%) | 87.4 | 2.9 | yes |
| qes2018 | Voters are more interested than nonvoters (mean, 1-4) | 3.0 | 2.5 | yes |
| qes2018 | QS voters are to the left of CAQ voters (mean, 0-10) | 3.7 | 6.0 | yes |
| qes2018 | Partisans who voted for their party: at least 55% (%) | 82.9 | yes | |
| qes2018 | Yes to independence: PQ voters more than 40 points above PLQ voters (%) | 85.9 | 2.5 | yes |
| qes2018_panel | QS voters are to the left of CAQ voters (mean, 0-10) | 3.8 | 5.7 | yes |
| qes2022 | QS voters are to the left of CAQ voters (mean, 0-10) | 3.7 | 5.5 | yes |
| qes2022 | Partisans who voted for their party: at least 55% (%) | 78.6 | yes | |
| qes2022 | Yes to independence: PQ voters more than 40 points above PLQ voters (%) | 82.0 | 2.2 | yes |
Reading the differences
Turnout is over-reported in every study, here by 14
to 30 points (qes1998, francophones only, is left out). Two
causes add up and cannot be told apart with these data: some nonvoters
say they voted, and people who vote are more willing to answer election
surveys in the first place. The face-saving question formats of
qes2018 and qes2022 (several ways to say one
did not vote) are meant to reduce the first; weights calibrated on age,
gender, education and language do not correct either. The two rates also
count different people: the official rate is over registered electors,
some of whom have moved or died, while the surveys ask adults they
reached. Any analysis of turnout from these studies describes
respondents, not the electorate.
The reported vote is a recall, and it is not the
vote. It is asked days to weeks after the election, of
respondents whose participation is itself selective. Recall is often
said to drift toward the winner, but the pattern here is not a simple
winner’s bonus: in qes2012 the PQ, which won by less than a
point, is over-reported by 6.9 points and the PLQ under-reported by 6.3;
in qes2022 the CAQ, which won, is under-reported by 8.0
points. Who answers matters at least as much as how people remember:
online panels tend to over-represent the politically engaged and the
educated, and the voters of some parties may be harder to reach.
Weighting on demographics does not remove this and can move the index
either way (compare the two columns of the first table).
The question matters. A party the question did not
list could only be reported as “other” (the Green Party in
qes2018 and qes2022, the Conservative Party in
qes2018). The two Durand panels of 2007 and 2012 ask the
vote without reading the parties, by telephone; the other studies read
or show a list. The grades of qes_spec(view = "crosswalk")
record these differences.
Samples are not the census population. The census
counts residents, including people who are not citizens and cannot vote;
qes2022 sampled citizens only. The census tables for mother
tongue and education cover private households, and their age cuts differ
from 18 and over (section 3). Three gaps stand out. Education: every
study has more respondents with some university than the census has
holders of a university credential, partly because the surveys ask the
level reached (a year of university counts) and the census the
credential completed, and partly, most likely, because people with more
education are more willing to answer surveys; qes2022,
weighted on education, is the only study close to the census. Mother
tongue in qes2018: English speakers are over-represented
and speakers of other languages under-represented; the 2018 weight
corrects French against all other languages (its methodological report,
Table 14), not the split between English and other languages. Age in
qes2018: its weight corrects age in generational cells
(16-18, 19-38, 39-58, 59-73, 74 and over: Table 12 of the same report),
which cut across the ten-year bands used here; within them the weighted
sample still has too few people aged 35 to 54 and too many aged 55 to
64.
These benchmarks are coarse. An index can hide errors that offset each other: in 2012 the PQ and the PLQ finished less than a point apart, so a study that swapped their codes would match the official results about as well. That is why the harmonization is also checked against exact counts of each answer in the original files and against the relationships of section 4, and why each mapping is checked against the questionnaire.
Sources
- Élections Québec, official results of the general elections of 1998 to 2022, province-wide votes by party and ballots cast, from its archived results files (for example https://donnees.electionsquebec.qc.ca/production/provincial/resultats/archives/gen2022-10-03/resultats.json).
- Statistics Canada, census tables 98-10-0020-01 (age and gender, 2016 and 2021), 98-10-0218-01 (mother tongue by age, 2011 to 2021) and 98-10-0384-01 (highest certificate by age and gender, 2006 to 2021); the 2011 Census Profile (catalogue 98-316-XWE2011001: age by sex); and the 2006 table 97-551-XCB2006009 (age by sex; the Internet Archive’s copy of Statistics Canada’s file).
The benchmark tables, with the source of every row, are in the qesR source repository.